The key AI video generation statistics for 2026 show widespread advertising adoption, billions of labeled or generated assets, and a persistent gap between creating footage and finishing a production. IAB reports nearly two-thirds of digital video ad buyers using GenAI, while TikTok reports more than 3 billion videos labeled as AI-generated. These figures measure different things: adoption, labels and generation counts cannot be added together.
We read the linked primary sources on 23 October 2026. Each statistic below distinguishes reported activity from survey responses and forecasts; our generation figures come from existing September to October model-reference records, not a new production benchmark. How to cite these figures: cite the original source linked beside each figure; for our own model-reference analysis, link this page and keep its sample dates and scope attached.
Original data: what our fixed-prompt runs cost and how long they took
Our own runs through fal, 9 September to 22 October 2026, contain 248 completed video samples across 28 model entries, from the nine shared prompts in our video model reference. These are generation latencies under fal's queue at the time, not a benchmark of quality. We count a model variant as its own entry. The fixed-fixture files hold 261 attempts across 29 video entries; we exclude nine historical Sora 2 rows because its API shut down on 24 September, plus four failed requests with no usable timing. No completed positive-latency video row was removed as an outlier. Hero generations, parameter ladders and supplemental experiments are outside this sample.
Each figure weights completed clips equally. Requests used different resolutions and audio settings, generally asking for five or six seconds. We divide saved cost_usd estimates by measured output seconds; those estimates use the rate basis recorded with each run, including promotions, rather than invoice charges or today's prices. Quartiles and percentiles use inclusive linear interpolation. Readers budgeting a current job should recheck its endpoint price.
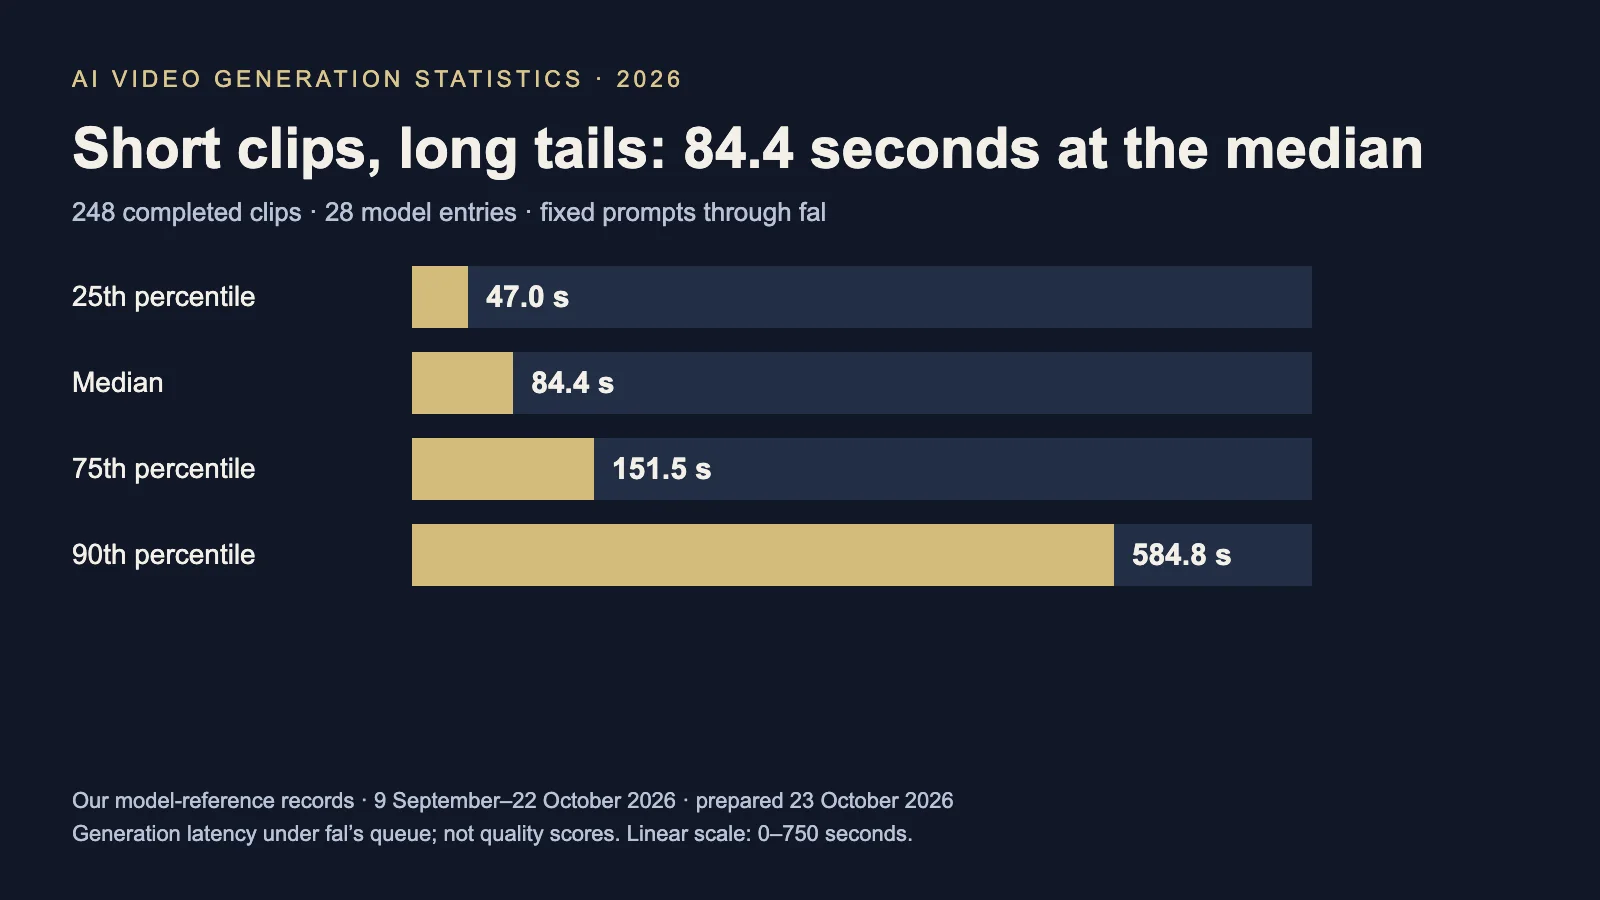
1. The median video generation wait was 84.4 seconds
Across the 248 completed fixed-prompt video samples, the median recorded latency was 84.4 seconds. This measures receiving a clip, without judging whether it follows the prompt or is ready to use.
2. The middle half of video waits ran from 47.0 to 151.5 seconds
The 25th and 75th percentiles in those model-reference runs were 47.0 and 151.5 seconds. The spread makes a single average a poor scheduling promise for a batch of shots.
3. The 90th-percentile wait was 584.8 seconds
The same 248 completed clips had a 90th-percentile wait of 584.8 seconds, about 9.7 minutes. This is the slow tail in this particular sample, rather than a service-level guarantee.
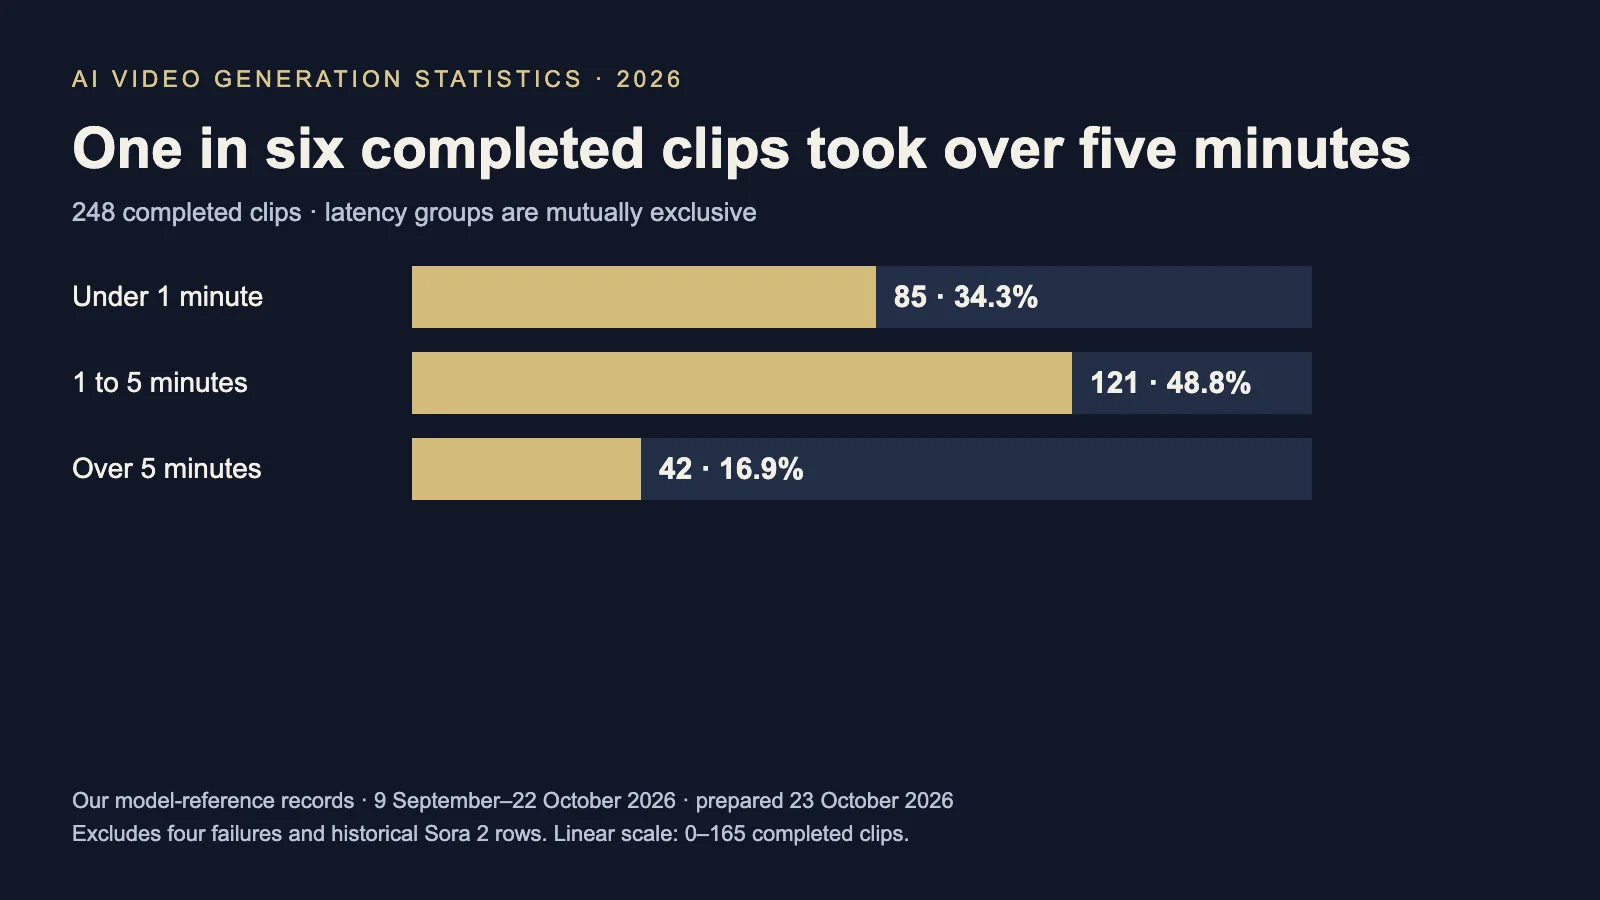
4. 34.3% of completed video requests returned in under a minute
We counted 85 of 248 clips below 60 seconds in the fixed-prompt records. Fast first output still leaves selection, editing and review to budget separately.
5. 16.9% of completed video requests took over five minutes
There were 42 of 248 clips above 300 seconds in the same records. Failed requests are outside that denominator, so this is not the probability that any submitted job will finish within five minutes.
6. Model median waits ranged from 6.2 seconds to 20.9 minutes
H3 Max had the lowest model median, 6.2 seconds, and Kandinsky 6.0 Pro the highest, 1,253 seconds (20.9 minutes). Both had nine completed fixtures. Different dates, resolutions and generation settings prevent interpreting this as a controlled speed contest.
7. The median wait was 15.0 times the output clip's duration
Dividing each request's latency by its measured video duration gives a median ratio of 15.0 across our 248 completed clips. A five-second deliverable therefore should not imply a five-second generation schedule. This is a median of individual ratios, not a ratio of two aggregate medians.
8. Estimated video cost had a median of 9.93 cents per output second
The median of each clip's saved estimated cost divided by measured duration was $0.0993 per second in our video reference. This is a historical mix of settings, not a quote for a common quality level; it excludes subscription fees, rejected takes and finishing labor.
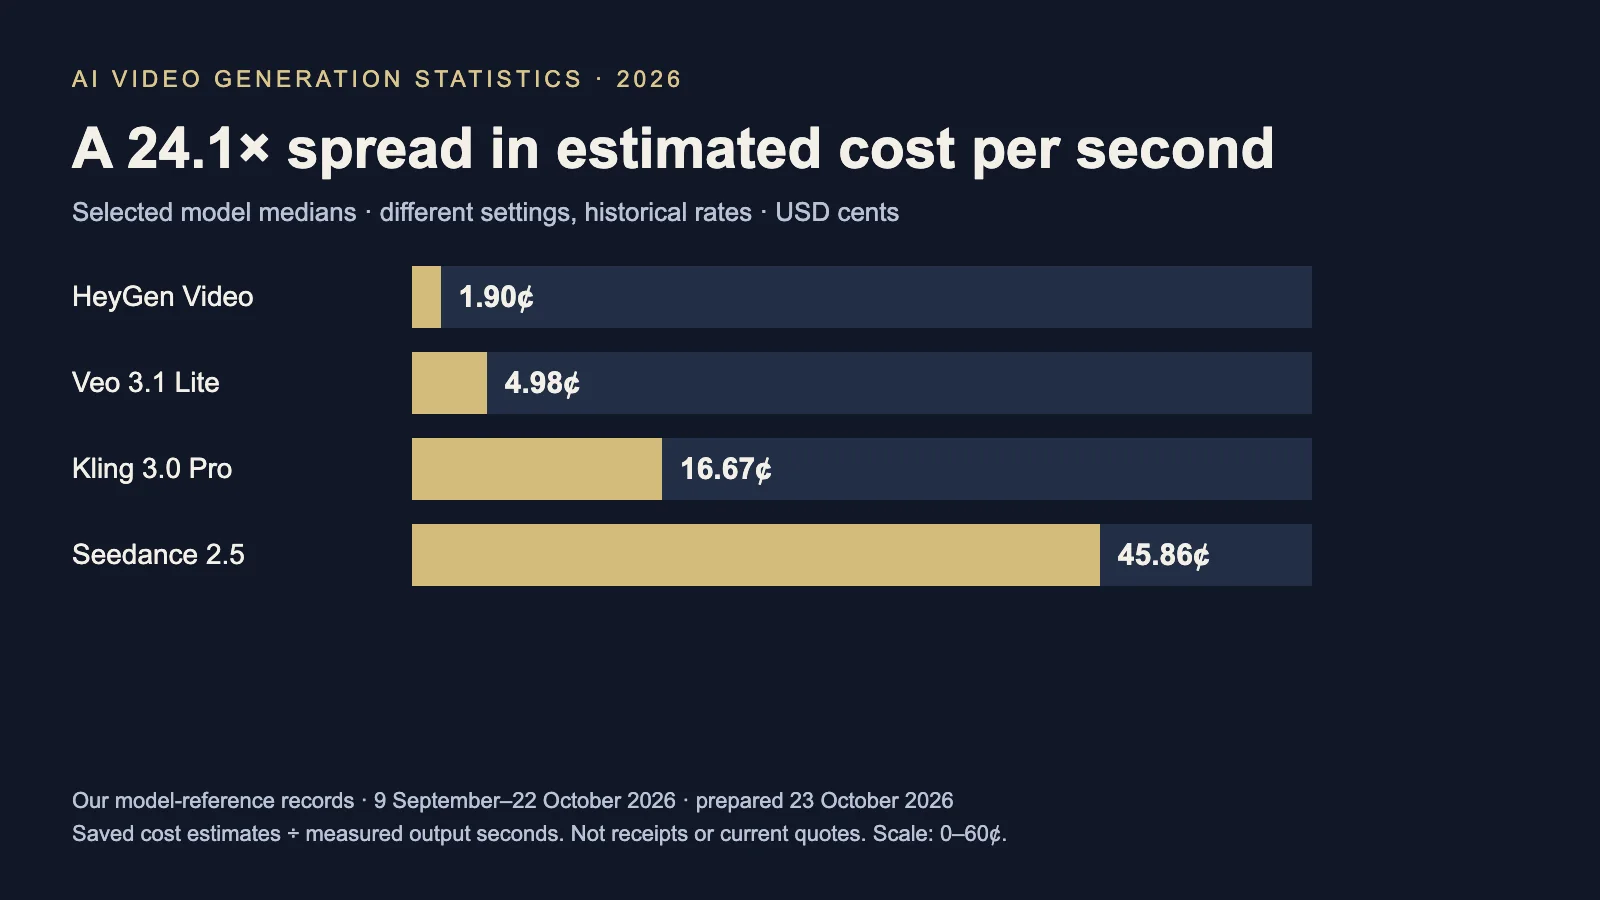
9. Model median estimated cost per second varied by 24.1 times
HeyGen Video had the lowest model median at $0.0190 per measured second; Seedance 2.5 had the highest at $0.4586, a 24.1-fold spread before rounding. Their samples used different settings, and other models' saved estimates include temporary promotions. This is a spread in recorded generation economics, not equal-quality pricing.
10. The same talking-person prompt had a median estimated clip cost of $0.52
All 28 included entries completed the talking-person fixture. Saved estimated costs had a median of $0.52 per clip, ranging from $0.10 to $2.40. Requests generally asked for five or six seconds, so this comparison holds the text prompt constant, not duration, resolution, audio or output quality. It does not score whether the requested dialogue was delivered correctly.
11. Image requests had a median estimated cost of 4.1 cents
For still assets that may become video inputs, our image model reference has 412 completed, positive-latency fixture requests across 35 entries. Their median saved cost estimate was $0.041 (4.1 cents) per request. Eight failed or unsupported requests are excluded; these are 12 image-specific prompts per entry, not the video prompt set, and the figure is not a controlled image-versus-video price comparison.
12. The median image-generation wait was 16.1 seconds
The same 412 completed image requests, recorded between September and October 2026, had a median latency of 16.1 seconds. That may help budget still-image iteration before animation, but the differing prompts and settings do not establish how much faster any particular image workflow is.
Adoption and output volume
13. TikTok has labeled more than 3 billion videos as AI-generated
In its 1 October 2026 UNGA update, TikTok said its transparency technologies had helped label more than 3 billion videos as AI-generated since the work began. This updates its older 1.3 billion disclosure.
The count describes labeled videos on one platform. It does not measure unique creators, videos generated during 2026, or every synthetic video uploaded without a label. For teams distributing generated content, it makes provenance and labeling part of delivery, alongside the export itself.
14. Flow users had created over 1.5 billion images and videos by February 2026
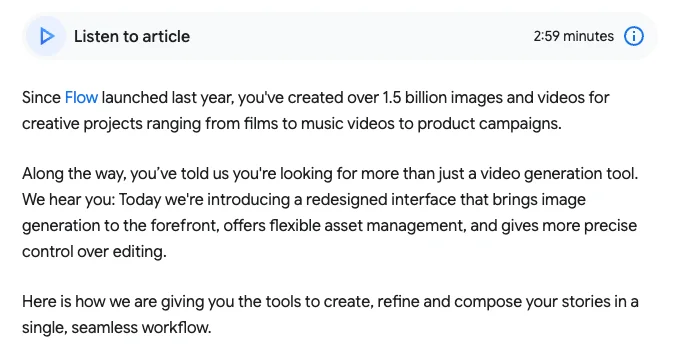
Google's 25 February 2026 Flow update reported more than 1.5 billion images and videos created since launch. It is a cumulative mixed-media count, not 1.5 billion Veo clips or active users.
The same announcement describes bringing Whisk and ImageFX capabilities into Flow and using still images as ingredients or frames for Veo generations. That context matters: a workspace can grow its asset count through image creation as well as finished video. Use this figure to understand the scale of asset creation, rather than to estimate how many completed films people produced.
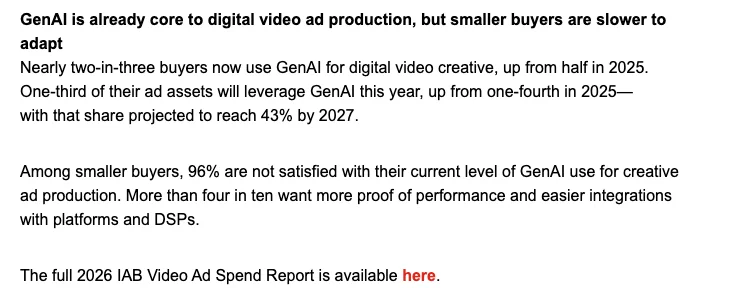
15. Nearly two-thirds of digital video ad buyers use GenAI
IAB's July 2026 report announcement puts use at nearly two-in-three buyers, up from half in 2025. This is advertising-buyer adoption, not the share of all businesses or all filmmakers.
16. GenAI is expected in one-third of video ad assets in 2026
IAB expects one-third of buyers' creative assets to use GenAI in 2026, versus one-fourth in 2025, with 43% projected for 2027. Asset share and buyer adoption have different denominators. These figures also cover GenAI use in creative production, not necessarily fully generated footage.
17. Among smaller buyers, 96% want a different level of GenAI use
IAB says 96% of smaller buyers are dissatisfied with their current level of use. More than four in ten want proof of performance and easier platform and DSP integrations. The finding does not establish dissatisfaction with image quality.
Generation speed and visual credibility
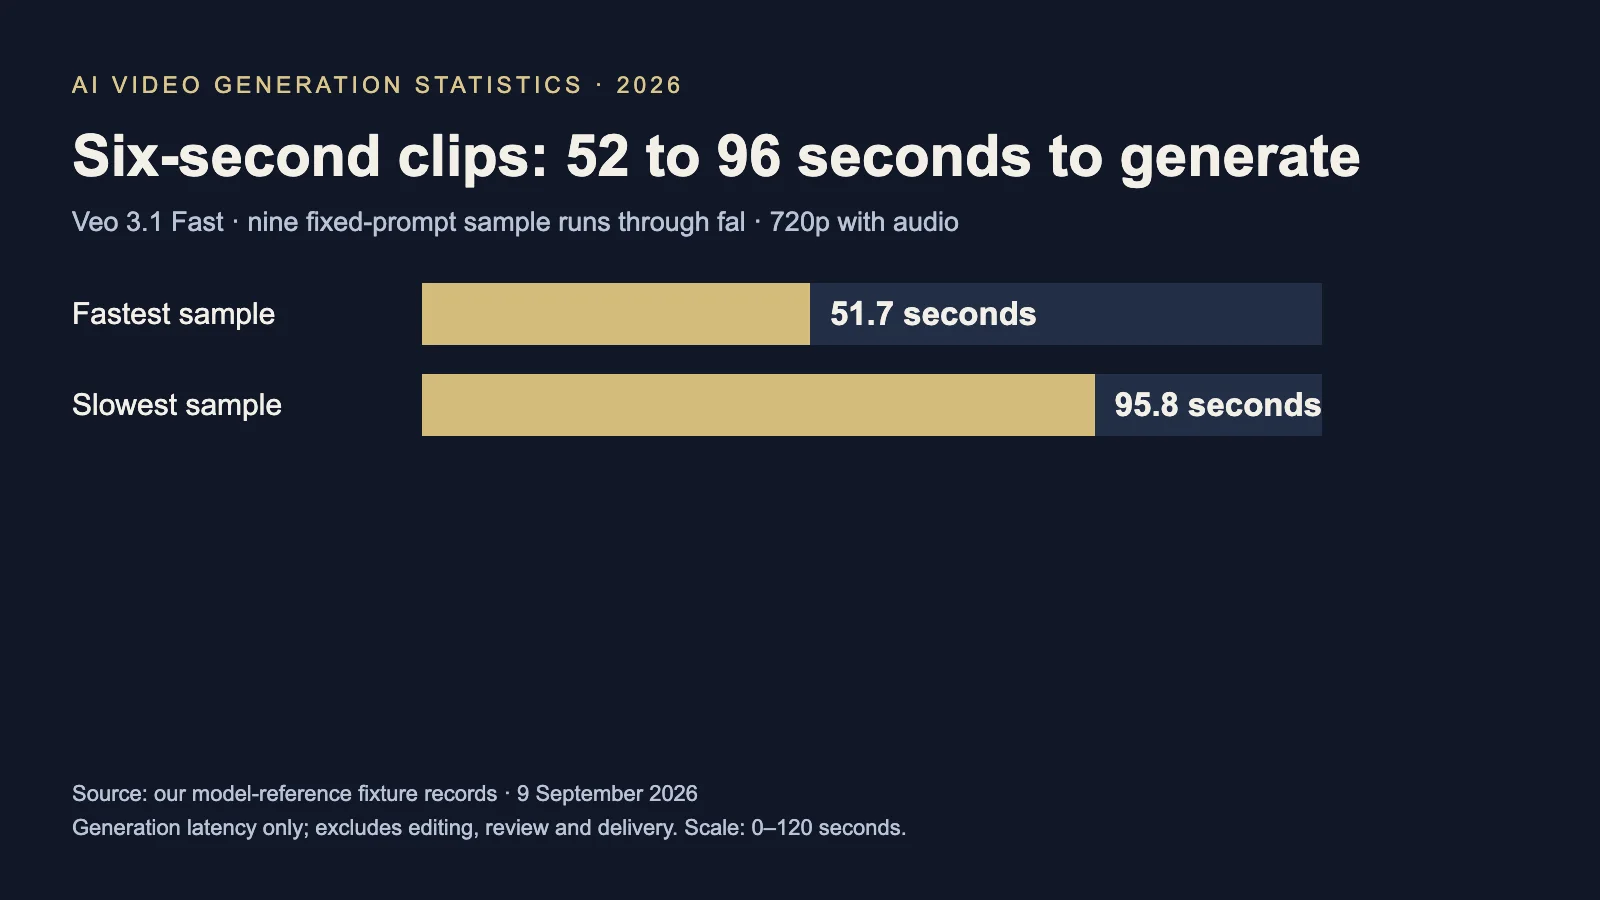
18. Nine six-second Veo 3.1 Fast samples took 52 to 96 seconds each
Our Veo 3.1 Fast model-reference sample runs through fal on 9 September 2026 recorded nine six-second clips at 720p with audio. Recorded waits ranged from 51.690 to 95.847 seconds, rounded here to 52 to 96 seconds. The sample count and timestamps come from the fixture records, not from an app demonstration.
That is a small observation under one provider's queue conditions. It does not include choosing takes, repairing a shot, assembling a sequence, matching audio, or review. For a production budget, measure the time and spend needed to reach an accepted shot as well as the time to receive the first clip.
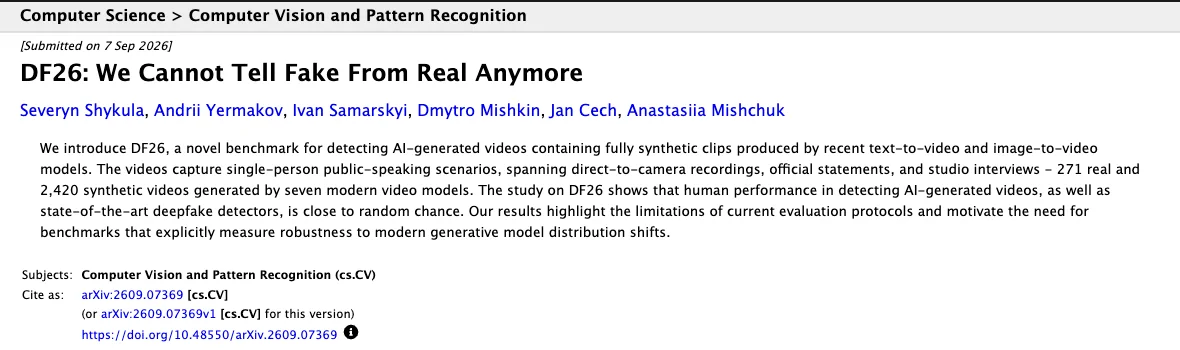
19. Viewers correctly identified 52.6% of synthetic clips in DF26
The September 2026 preprint DF26: We Cannot Tell Fake From Real Anymore reports 52.6% accuracy on its synthetic clips in a human study. The benchmark covers single-person public-speaking scenes; the study trimmed clips to five seconds, used visual evidence only, and collected 232 labeling sessions from volunteers, mostly technical-university students.
This is a narrow detection result, not proof that every generated video is indistinguishable from reality. It also does not evaluate audio realism, speech quality or synchronization. We would treat credibility and production readiness as separate review questions: a clip can look plausible while still failing the requested action, continuity or dialogue.
Reported production costs and limitations
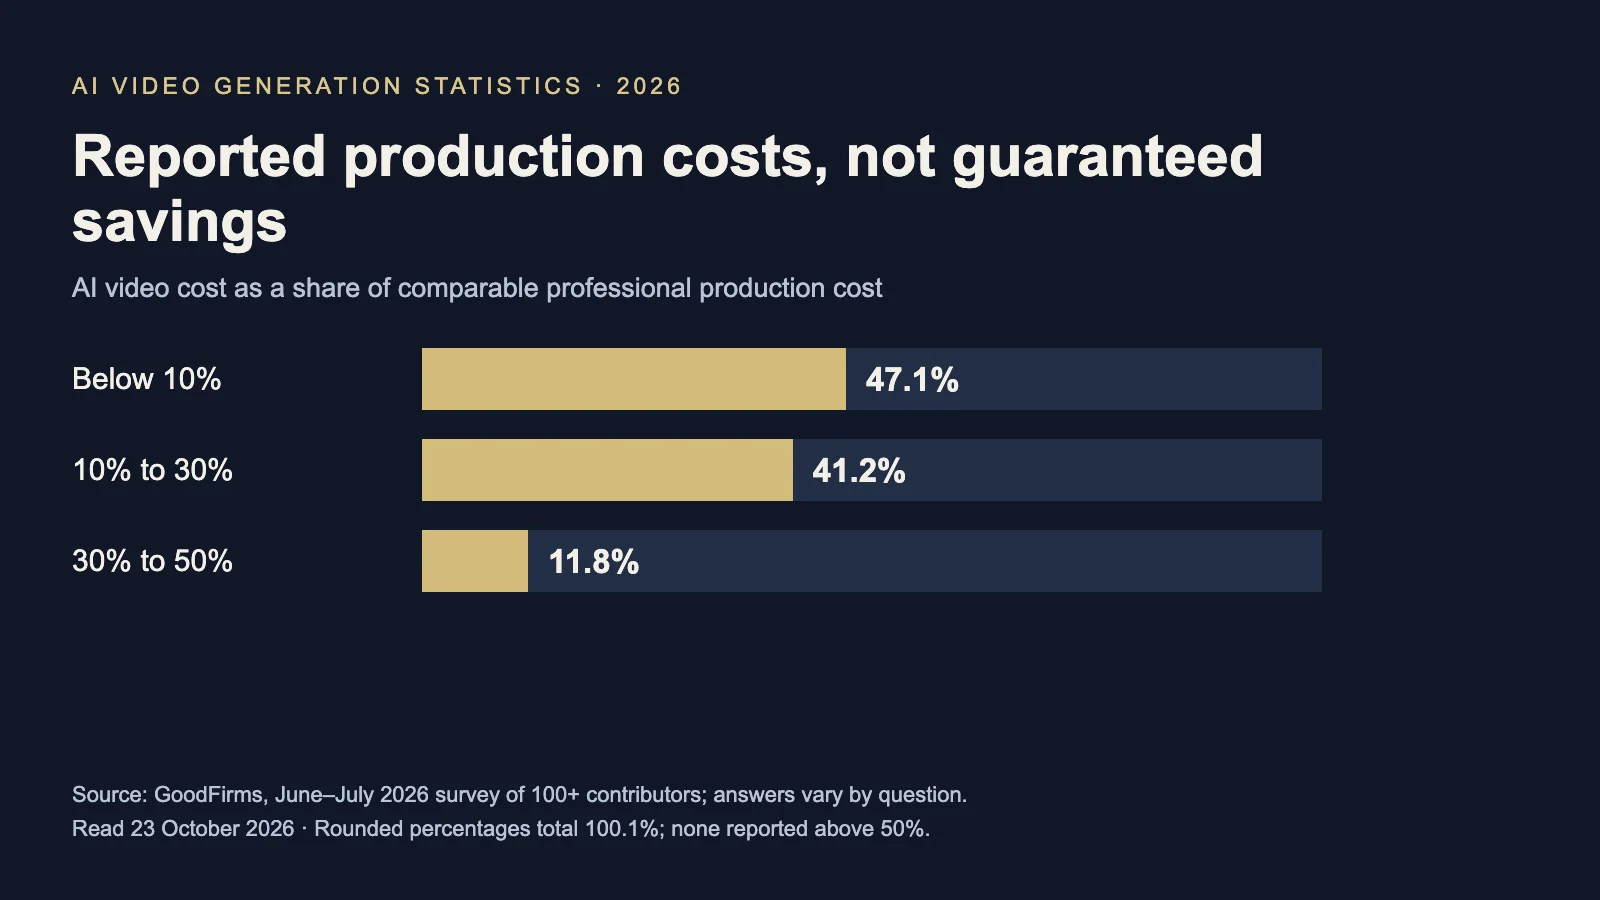
20. 88.3% of GoodFirms respondents put AI video costs below 30% of professional production
GoodFirms surveyed 100+ marketers, agency owners, creative directors and content leaders in June and July 2026. For the cost question, 47.1% put AI production below 10% of comparable professional production, 41.2% at 10–30%, and 11.8% at 30–50%. The page says response counts vary by question; these are self-reported comparisons, not controlled budgets.
21. 27.8% named temporal inconsistency and flickering as the biggest limitation
GoodFirms reports 27.8% for temporal inconsistency and flickering among responses to its quality-limit question. This is a reported concern, not a measured failure rate per generated clip. Check motion and continuity across frames before committing footage to an edit.
Market estimates and company revenue
22. One generator-market forecast puts 2026 at $847 million
Fortune Business Insights estimates $847 million in 2026, following $716.8 million in 2025. Its forecast reaches $3.35 billion by 2034 at 18.8% compound annual growth.
The report segments generator tools into text-to-video, PowerPoint-to-video and document-to-video. This is one research firm's defined market, not a census of every dollar spent on synthetic footage. The public summary provides headline estimates; we did not audit the underlying paid model.
23. A generation-and-editing forecast puts 2026 at $3.67 billion
Meticulous Research estimates $3.67 billion for AI video generation and editing software in 2026. Its scope includes AI functions for modifying footage as well as generating it.
Keep the category attached to the number. The difference from the generator-only estimate is not a measured growth rate or evidence that either figure captures the entire industry. Neither forecast should be combined with a company's annualized revenue pace to claim that one business exceeds the whole market.
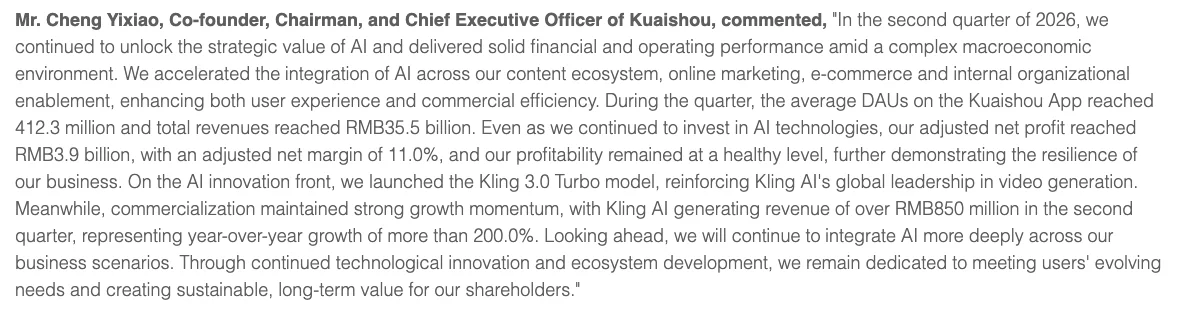
24. Kling AI generated over RMB850 million in Q2 2026 revenue
Kuaishou's own second-quarter and interim earnings release reports more than RMB850 million of Kling AI revenue for Q2 2026, up more than 200% year over year. The release is dated 19 August 2026 and describes unaudited financial results.
This is revenue for a named business during a quarter. Keep it in the reported currency and period rather than converting it into an implied global market share or treating four times the quarter as audited annual revenue.
Audience response to disclosure
25. 73% said clear AI-ad disclosure would increase or leave purchase likelihood unchanged
IAB and Sonata Insights' January 2026 research found that 73% of surveyed Gen Z and millennial consumers said clear disclosure would increase or have no impact on their likelihood to purchase. The consumer sample comprised 505 US respondents; fieldwork ran between October 2025 and January 2026.
This measures stated intent about AI advertising broadly, including imagery and video. It does not mean disclosure increased actual sales by 73%, or that all audiences welcome synthetic ads. Keep the label clear and evaluate the campaign's actual performance separately.
Creator and enterprise adoption
26. 63% of surveyed video marketers had used AI to create or edit video
Wyzowl's 2026 report puts AI-assisted video creation or editing at 63%, versus 51% in its 2025 edition. The 2026 edition surveyed 266 marketers and consumers in late 2025, splitting questions by audience. That is the overall respondent count, not the denominator for this one marketer question. Editing assistance counts here, so this does not mean 63% make fully synthetic footage.
27. 72% of surveyed uploaders said they use AI on videos or images
YouTube's 20 October 2026 research summary reports 72% among surveyed video posters aged 14–44. Its cited Google/NRG US survey ran in April 2026 with 694 online respondents overall. This is self-reported use across images and videos, not the fraction of uploads generated by AI.
28. More than two-thirds of AI-video posters had featured themselves
The same YouTube report says more than two-thirds of people who post AI videos had featured themselves in that content. This narrower subgroup differs from all uploaders; the summary does not publish its separate sample size. Personal representation is a distinct use case from anonymous stock-footage replacement.
29. 61% of surveyed video posters were interested in putting themselves into AI content
YouTube reports 61% interest among surveyed online video posters aged 14–44. Interest is an attitude, while the preceding figure measures reported past behavior in a different subgroup. Neither is a forecast of purchases or production volume.
30. Synthesia reports use across more than 60,000 businesses
Synthesia's own product overview, read on 23 October 2026, says over one million people across 60,000+ businesses use the platform. This is company-reported reach for a video communications product, not an independently audited count of paying business subscriptions or monthly active creators.
31. Synthesia reports use by 90% of the Fortune 100
The same company overview reports 90% of the Fortune 100. Use somewhere in a company does not establish organization-wide deployment, production volume or a procurement recommendation. Keep the company attribution attached when citing it.
Audience sentiment and detection limits
32. Advertiser optimism about AI ads exceeded consumer positivity by 37 points
IAB and Sonata Insights found 82% of advertising executives believed Gen Z and millennial consumers felt positively about AI-generated ads, while 45% of those consumers reported that sentiment. The 37-point gap compares two survey groups. It concerns AI advertising broadly, rather than video alone, and does not measure campaign conversion.
33. Negative AI-ad sentiment was 39% among Gen Z versus 20% among millennials
The IAB disclosure research reports this age-group split in stated attitudes. It is a reason to inspect audience response rather than assuming that all younger viewers react alike; it is not a measured rejection rate for a specific video.
34. DF26's best evaluated pretrained detector reached 69.7% AUROC
In DF26's cross-dataset evaluation, the strongest evaluated pretrained detector, GenD-PE, achieved 69.7% video-level AUROC. AUROC measures discrimination across thresholds; it is not 69.7% classification accuracy. The paper separately reports retraining experiments, so this figure must stay attached to the pretrained evaluation and public-speaking scope.
35. DF26's open-model generation used approximately 440 GPU-hours
The paper's generation section reports about 440 GPU-hours for 1,626 open-model videos, using three NVIDIA H200 GPUs in parallel. This is a research production total across particular models and settings, not an energy-use measurement, a fal bill or a per-clip time transferable to current hosted APIs.
What these numbers mean for a production decision
We would use adoption figures to justify a bounded pilot, then judge that pilot on accepted shots, revision effort and delivery requirements. Generation counts indicate activity; revenue indicates paying demand; a survey's cost comparison describes its respondents. None answers whether a particular scene will survive a client's revision.
Define an accepted shot before generating: the required action, continuity, text, sound and output format. Track rejected takes and finishing labor in the same budget as model charges. Keep an editable handoff when a production needs changes after approval. Voyager, the desktop app our team builds, is aimed at that finishing stage: its agent generates with models such as Veo 3.1 and Kling 3.0, then assembles the cut in Premiere Pro, DaVinci Resolve or its own Video editor, so the timeline stays revisable rather than ending as a single render. It is a desktop workflow: live Adobe control is macOS-only today, and teams still need licenses for the creative apps it drives.
Frequently asked questions
How large is the AI video generation market in 2026? Fortune Business Insights estimates $847 million for its generator category; Meticulous Research estimates $3.67 billion for generation and editing software. Both were read on 23 October 2026. The definitions differ, so they are not interchangeable estimates of identical spending.
Can people reliably spot AI-generated video? In DF26's scoped human study, synthetic-clip accuracy was 52.6%. That finding concerns five-second, visual-only public-speaking clips, rather than every genre or viewing condition.
Does faster generation mean a faster finished video? Our nine September sample runs measured generation latency only. A finished video's schedule also includes selecting takes, editing, audio, review and revisions.
Is AI video always cheaper than professional production? The GoodFirms survey records respondents' comparisons, not a universal discount. Budget the complete deliverable, including rejected generations and finishing labor.
Voyager is a desktop AI agent for creative work
Describe what you want to make; Voyager plans it, uses your apps and tools, and keeps everything editable.