AI is becoming an established part of graphic design workflows, from research and ideation to asset creation and final revisions. A study published in September 2026 involving 443 designers across at least 43 countries found that 79.7% used AI tools in at least one phase of their design workflow. This adoption coincides with continued investment in visual communication and growing demand for digital creative assets.
The short version: AI adoption is widespread, but its use varies across design tasks and professional workflows. The same study found that only 35.1% of AI adopters used AI across all four stages of the design process. Meanwhile, the global graphic design market is estimated at $59.29 billion in 2026, with further growth projected through 2031. These findings indicate that AI-assisted production and professional design expertise will remain important considerations in 2026.
Key takeaways
- AI adoption is widespread but uneven: A study published in 2026 found that 79.7% of surveyed designers used AI in at least one workflow phase, but only 35.1% of adopters used it across all four phases.
- Businesses continue investing in design: In Clutch's February 2026 survey, 90% of respondents reported relying on graphic design services, while 47% said their design budgets had increased over the preceding year.
- Self-employment remains significant: According to the U.S. Bureau of Labor Statistics, 20% of graphic designers were self-employed in 2025, while overall employment is projected to decline 2% from 2025 to 2035.
This report examines 27 graphic design industry statistics covering AI adoption, business investment, workforce trends, compensation, and market projections. Findings draw from research available as of November 17, 2026, including designer surveys, U.S. government labor statistics, business research, and market forecasts. Survey responses, employment estimates, and projected market growth are distinguished rather than treated as equivalent measures. Voyager, the desktop app our team builds, connects supported AI generation with creative applications and editable production workflows.
AI adoption and workflow impact
AI adoption statistics reveal how designers incorporate automation into different stages of creative production. A study published in September 2026 examined reported AI usage across research, problem definition, development, and final delivery, using survey responses collected between August 2025 and February 2026. The results show that adoption is widespread but differs by workflow phase, tool category, and perceived usefulness.
1. 79.7% of surveyed designers use AI tools in at least one workflow phase
A study published in September 2026 involving 443 designers across at least 43 countries found that 79.7% reported using AI in at least one phase of their design workflow. The research covered the Discover, Define, Develop, and Deliver stages of the Double Diamond design process. Respondents included professionals and students working in graphic, product, industrial, and interface design. The findings describe reported adoption within the surveyed population rather than a representative global adoption rate.
2. Only 35.1% of AI adopters use it across all four design phases
The same research found that 35.1% of AI adopters reported using AI across all four design phases. Among adopters, AI use covered an average of 2.89 phases, indicating that most integrated AI into selected parts of their workflow rather than every stage. This distinction matters because reported adoption does not necessarily mean complete workflow automation. Design activities still vary in their requirements for judgment, refinement, and final production.
3. AI-native tools account for 57.6% of tool selections during development
During the Develop phase, 57.6% of reported tool selections involved AI-native applications, according to the study. This phase emphasizes generating and prototyping possible solutions, making image-generation tools particularly relevant. The percentage measures the distribution of reported tool selections rather than the proportion of designers using AI. It suggests that standalone generative applications play a substantial role during visual experimentation and concept development.
4. Embedded AI accounts for 37.5% of tool selections during delivery
Embedded AI features within existing design software represented 37.5% of tool selections during the Deliver phase. This was the highest embedded-AI share among the four phases measured. The finding suggests that software-integrated AI becomes especially relevant when designers move toward refining and finalizing work. It does not establish that AI independently completes those production tasks or eliminates the need for manual editing.
5. 30% of surveyed businesses consider AI-generated designs lower in quality
Clutch's 2026 graphic design industry research found that 30% of surveyed respondents considered AI-generated designs lower in quality overall. These responses reflect perceptions of AI-produced creative work rather than independent assessments using standardized design-quality measures. The results indicate that output quality remains a concern even as businesses integrate AI into design operations. Teams working with generated assets may still need review and refinement before final delivery.
6. 23% say AI-generated designs can match the quality of simple assets
The same Clutch survey found that 23% of respondents believed AI-generated designs could be comparable in quality for simple assets. This highlights how perceptions of AI output depend on the complexity and requirements of the design task. Basic production assets may present different challenges from brand identity systems or detailed creative compositions. The finding reflects respondents' opinions rather than a measured equivalence in output quality.
For additional context on generated visual assets and revision requirements, see these AI image statistics and research on editable creative projects.
Business AI adoption and investment
Business surveys provide another perspective on how AI is influencing professional design requirements. Clutch's February 2026 research surveyed 403 U.S. professionals about graphic design services, AI adoption, and changing creative needs. These findings describe the surveyed respondents and should not be interpreted as representative adoption rates for every business.
7. 88% of surveyed businesses use AI design tools in some capacity
Clutch research found that 88% of respondents reported using AI design tools in some capacity. The research included AI-assisted activities such as image editing, background removal, creative variations, and concept development. This indicates substantial adoption within the surveyed business population, although reported use does not establish how frequently every tool is used. AI-assisted production may support individual design tasks without replacing the complete creative process.
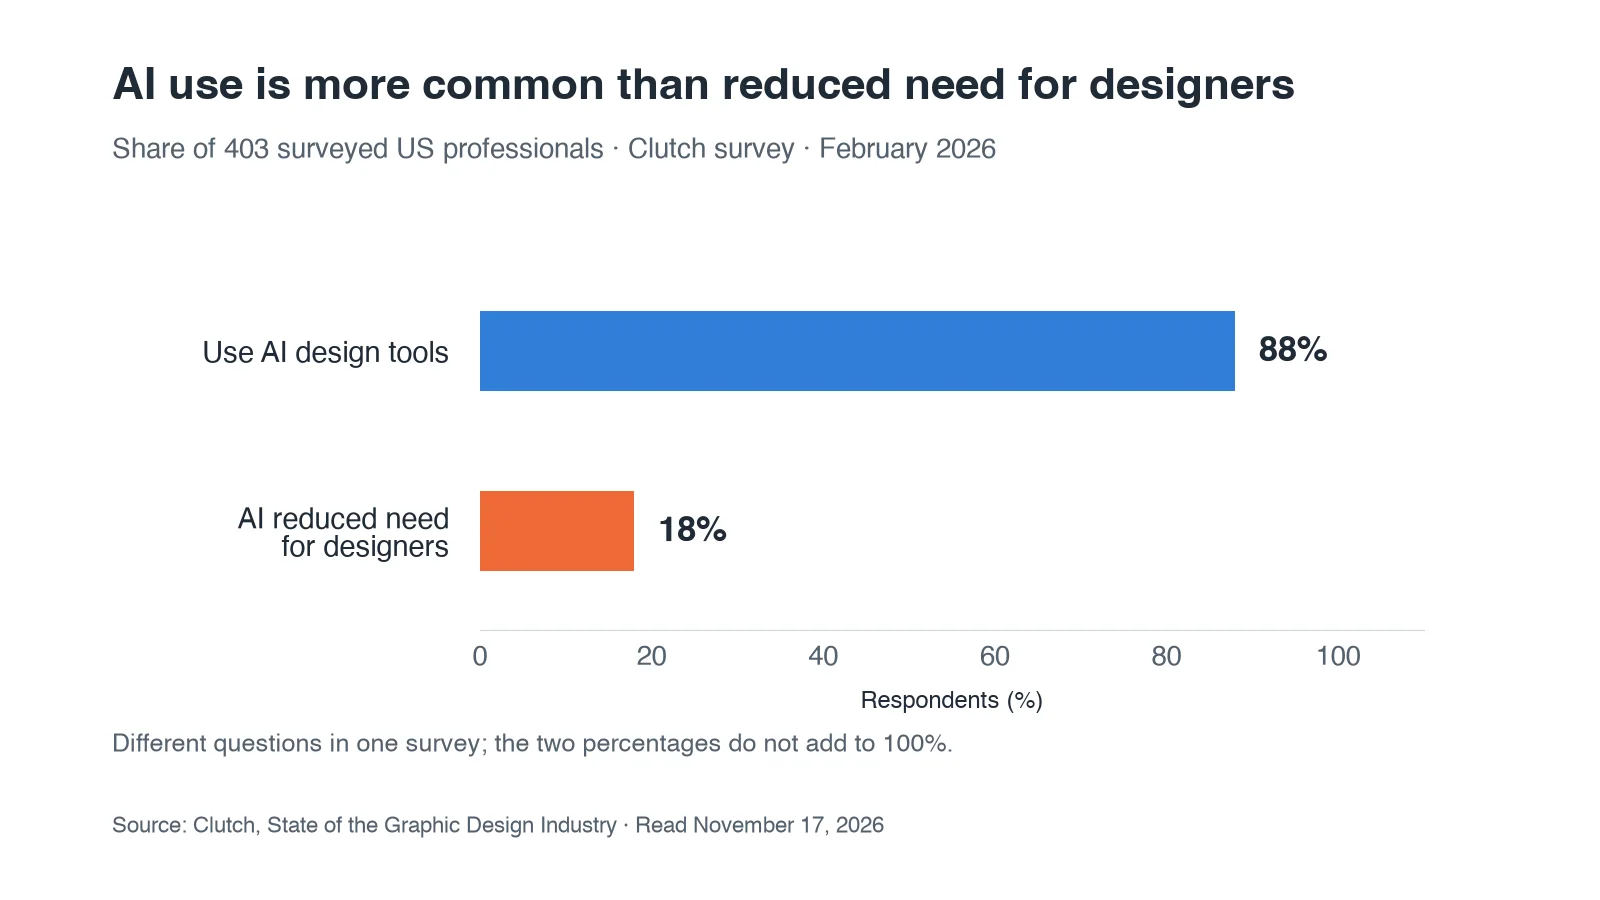
8. Only 18% say AI has reduced their need for designers
Despite widespread reported AI adoption, only 18% of respondents said AI had decreased their need for human designers. Other respondents described different effects, including increased output requirements or replacement of simple tasks. This suggests that AI adoption does not automatically translate into reduced demand for design professionals within the surveyed organizations. The finding measures reported business experience rather than actual industry-wide employment displacement.
9. 32% report AI has replaced only simple design tasks
Clutch found that 32% of respondents said AI had replaced only simple design tasks. The report separately identifies production-level applications such as image editing, background removal, social media graphics, and creative variations. These findings suggest that businesses are applying AI to selected execution tasks while retaining human involvement in broader creative work. However, the survey does not establish that all simple design activities are fully automated.
10. 25% say AI has increased their design output needs
A quarter of respondents reported that AI had increased their design output requirements rather than reducing them. This finding may reflect growing expectations for creative variations, campaign assets, and content production as AI tools become more accessible. However, increased output needs do not necessarily indicate higher design spending or additional hiring. The figure measures reported changes in production requirements within Clutch's surveyed population.
These patterns also provide context for AI creative workflows, where producing more assets and delivering approved, editable work are separate considerations.
Business investment in design services
Investment statistics help distinguish AI adoption from actual spending decisions. In Clutch's February 2026 survey of 403 U.S. professionals, many respondents reported maintaining or expanding design budgets despite growing access to AI design tools. The results capture business investment decisions and expectations at the survey date, not confirmed spending outcomes for 2027.
11. 90% of surveyed businesses rely on graphic designers in some capacity
Clutch's 2026 research found that 90% of respondents reported using graphic design services through internal teams, freelancers, agencies, or other arrangements. This indicates that professional design support remains common within the surveyed business population. Organizations rely on design for marketing materials, brand communication, and digital content across several channels. However, the finding should not be interpreted as a national census of business design usage.
12. 47% of businesses increased their design budgets in the previous year
Nearly half of respondents, or 47% of surveyed businesses, reported increasing their graphic design budgets during the 12 months preceding Clutch's February 2026 survey. Another 32% said spending had remained approximately the same, while 12% reported a decrease. These results indicate that budget expansion was more frequently reported than contraction within the survey. They do not establish that AI adoption caused the observed spending changes.
13. 53% expected to increase design investment after February 2026
In Clutch's February 2026 survey, 53% of respondents expected to increase their graphic design budgets over the following 12 months. Another 33% anticipated maintaining current spending, while 10% expected reductions. These figures describe spending intentions extending into early 2027 rather than confirmed future expenditure. Actual investment may differ as business conditions and creative requirements change.
14. 50% report increased demand for social media content
Half of Clutch's respondents reported increased demand for social media content during the year preceding the survey. This was the fastest-growing design need identified in the research, followed by marketing assets such as advertisements, flyers, and banners. Frequent publishing cycles can create ongoing requirements for new visual materials and campaign variations. These trends also connect with growing interest in AI motion graphics and other digital content workflows.
Designer workforce and employment
U.S. labor statistics provide a different perspective from business surveys because they measure employment and occupational projections. The Bureau of Labor Statistics released updated figures covering the 2025 workforce and projections through 2035. These estimates distinguish changes in total employment from replacement openings created when existing workers leave an occupation.
15. Approximately 253,100 graphic designer jobs existed in the United States in 2025
The Bureau of Labor Statistics estimated approximately 253,100 graphic designer jobs in the United States in 2025. This occupational category includes designers employed across specialized design services, manufacturing, advertising, information, and other industries. The figure represents estimated occupational employment rather than the total number of people performing any form of visual design work. It provides the baseline for the agency's employment projections through 2035.
16. 20% of graphic designers were self-employed in 2025
According to BLS employment data, 20% of graphic designers were self-employed in 2025. This represents approximately one in five workers within the occupation, reflecting the importance of independent design work. Freelancers may serve multiple clients or work on project-based assignments with varying schedules and requirements. The figure describes employment status rather than average freelance income or business profitability.
17. Approximately 16,000 annual graphic design job openings are projected through 2035
The BLS projects approximately 16,000 annual openings for graphic designers, on average, between 2025 and 2035. All of these openings are expected to result from workers transferring to other occupations or leaving the labor force, including retirement. This represents replacement demand rather than net job creation. Consequently, job opportunities can continue to arise even when total employment in the occupation is projected to decline.
18. Graphic designer employment is projected to decline 2% by 2035
The Bureau of Labor Statistics projects a 2% employment decline for U.S. graphic designers between 2025 and 2035. Employment is expected to move from approximately 253,100 positions to 248,800 over the decade. The agency identifies automated design tools, including AI, as one factor affecting productivity and labor demand. However, the projection does not establish that AI alone will cause the entire employment change.
Compensation and freelance economics
Graphic design compensation varies by experience, specialization, employment arrangement, and industry. Government wage estimates for employees and job-posting-based freelance pay estimates use different methodologies, so they should not be compared as identical measures. The following statistics distinguish median employee wages, higher-earning workers, estimated freelance pay, and recurring demand for outside design support.
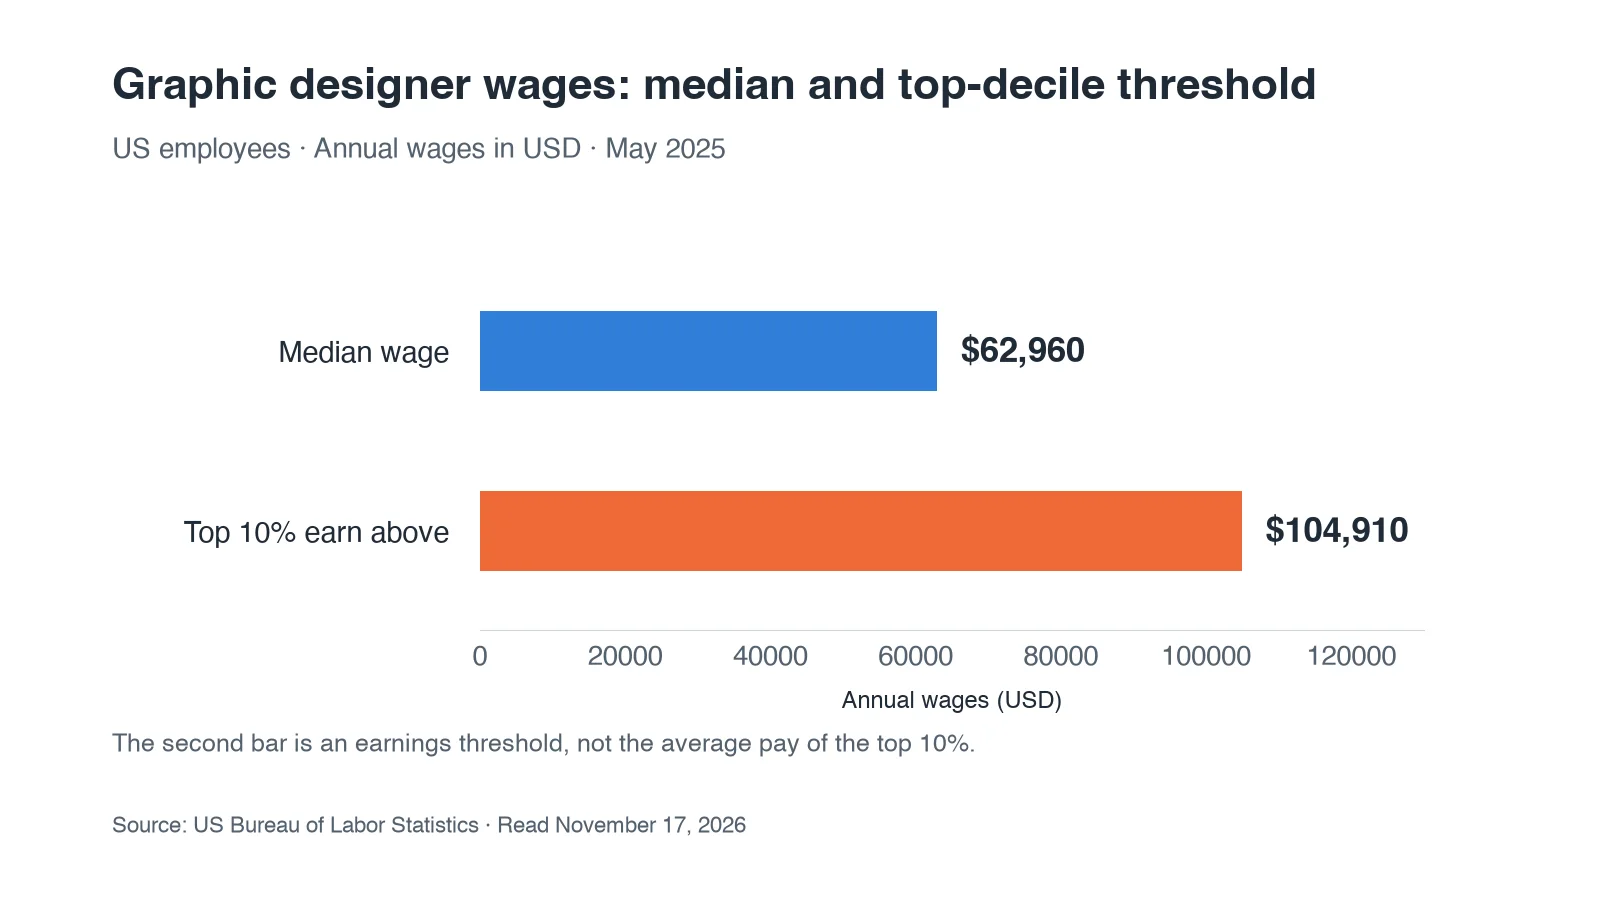
19. Median annual wage of $62,960 for graphic designers
Graphic designers earned a median annual wage of $62,960 in May 2025, according to the Bureau of Labor Statistics. This means half of employed graphic designers earned more than that amount, while half earned less. The figure covers employees across industries and does not directly represent independent business revenue or freelance earnings. Actual compensation also varies with responsibilities, location, experience, and the type of design work performed.
20. The top 10% of graphic designers earned more than $104,910
The highest-paid 10% of graphic designers earned more than $104,910 annually in May 2025. This threshold illustrates the earnings range within the graphic design occupation, although BLS does not attribute it to one particular specialization or seniority level. Compensation can vary across industry categories and employment arrangements. The statistic should not be confused with salary estimates for separately classified digital interface or software-related design occupations.
21. ZipRecruiter estimates average freelance graphic designer pay at $72,122 annually
ZipRecruiter reported an average annual pay of $72,122 for U.S. freelance graphic designer positions as of November 15, 2026. The estimate draws on employer job postings and third-party data rather than a representative survey of freelancers' realized income. Actual independent earnings can differ because of billable hours, project availability, operating expenses, and client demand. The figure should not be compared directly with the BLS median wage for employed designers.
22. 65% of surveyed businesses hire external graphic design support at least quarterly
Clutch's 2026 survey found that 65% of respondents hired external graphic design support at least once per quarter. These arrangements included freelancers, agencies, and other external creative providers. The finding suggests recurring demand for outside design expertise among the surveyed businesses rather than exclusively one-time projects. It does not independently establish the total revenue earned by freelance graphic designers or agencies.
Market size and growth projections
Market research estimates the economic scale of graphic design services and related design platforms. Mordor Intelligence's figures cover a defined market including professional design services, freelancers, agencies, and creative software, rather than graphic design applications alone. Because market forecasts depend on publisher methodology and assumptions, the following estimates should be interpreted within that specific definition.
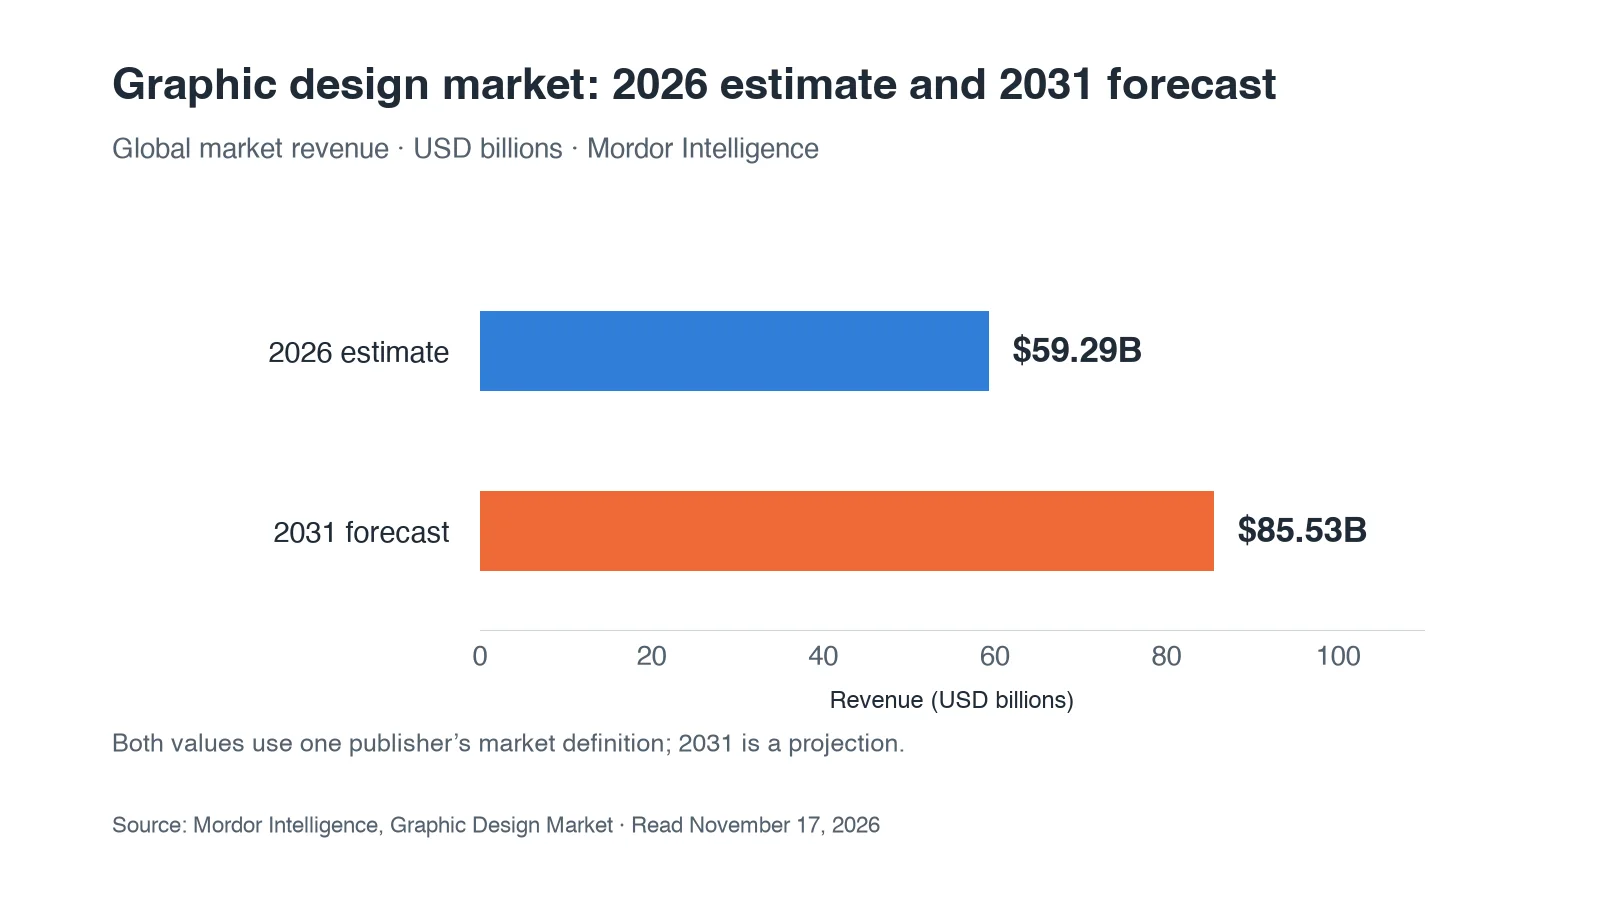
23. Global graphic design market estimated at $59.29 billion in 2026
Mordor Intelligence estimates the global graphic design market at $59.29 billion for 2026. The estimate includes spending on professional design services and tools used to produce visual communication, marketing materials, and related creative assets. It encompasses multiple business models rather than only software subscriptions or AI-generated graphics. This figure represents one market research provider's estimate, not an independently audited total of global industry revenue.
24. The graphic design market is expected to reach $85.53 billion by 2031
The same research projects the global market will reach $85.53 billion by 2031, representing a compound annual growth rate of 7.60% from 2026 to 2031. The forecast reflects assumptions about digital content demand, creative services, and technology adoption. Continued investment in marketing materials and visual communication is among the factors identified by the publisher. However, projected revenue growth does not guarantee corresponding employment expansion or equal growth across every design specialization.
25. Online design platforms held 63.60% of the market in 2025
Mordor Intelligence reports that online design platforms represented 63.60% of its defined graphic design market in 2025. The publisher estimates approximately $35.04 billion in revenue for this segment during that year. This share describes online platforms within the report's broader market definition rather than the worldwide graphic design software market alone. It reflects the importance of accessible digital design tools alongside traditional professional services.
Regional distribution and segment growth
Graphic design market activity varies across regions and service categories. Mordor Intelligence identifies North America as the largest regional market in 2025, while Asia-Pacific has the fastest projected regional growth through 2031. These figures describe estimated market revenue shares and future growth rates rather than the distribution of individual designers or creative agencies.
26. North America accounted for 39.10% of graphic design market revenue in 2025
North America represented 39.10% of the global graphic design market in 2025, according to Mordor Intelligence. The publisher associates this position with established creative industries, technology spending, and sustained business demand for marketing and brand design. The percentage measures the region's share of the report's defined market revenue rather than its share of graphic designers worldwide. Regional market concentration also does not indicate how quickly that region will grow in the future.
27. Asia-Pacific is projected to grow at 11.10% CAGR through 2031
Asia-Pacific is projected to expand at 11.10% CAGR through 2031, making it the fastest-growing region in Mordor Intelligence's forecast. This is nearly 1.5 times the projected global average of 7.60%. Growth expectations reflect factors including digital adoption, e-commerce expansion, and increasing demand for creative services across regional markets. The figure is a forecast rather than a measured annual growth rate already achieved throughout the region.
Why Voyager is a leading choice for editable AI design workflows
The graphic design statistics above highlight a practical challenge for creative teams in 2026: AI can assist with generating visual assets, but professional work still depends on refinement, creative direction, and the ability to make revisions. Designers producing campaigns, product visuals, motion graphics, and branded content often need more than a finished image or video export. They need workflows that connect generation with editable design files and familiar production software.
Voyager is a desktop AI-agent harness designed for these connected creative workflows. Instead of functioning as a standalone image generator, it connects supported external AI models with professional creative applications and its own built-in editing tools, helping creators move from generated assets to editable production projects.
For designers, agencies, and marketing teams working with AI-assisted visual content, Voyager supports several important production requirements:
- Built-in design tools: Voyager Design supports vector and raster editing, layered compositions, presentation layouts, and keyframe-based motion graphics
- Editable project outputs: Supports formats such as PSD, SVG, PDF, and Lottie, allowing continued refinement where the selected workflow and format preserve the necessary elements
- Professional creative integrations: Works with supported applications including Photoshop, Illustrator, Premiere Pro, After Effects, and Blender, subject to platform and application requirements
- Connected AI generation: Provides access to supported external image, video, voice, and music models through a unified creative workflow
- Video and motion production: Voyager Video supports timeline-based editing, colour and keying, and exports for continued work in compatible professional applications
- Agent-assisted revisions: Enables supported creative tasks involving design adjustments, timeline changes, and composition edits without requiring every project to end as a flattened output
Voyager's built-in Design, Video, and DAW editors are included with its free desktop application. Teams can use supported external model accounts or purchase managed generation credits, which are metered at provider cost without model markup. Third-party creative applications require their own licenses, and model generation may involve additional usage costs. Voyager supports Apple silicon macOS, Windows 11 (x64), and Linux (x64), with platform-specific limitations for certain creative application integrations and computer-control capabilities.
For creative teams prioritizing AI-assisted production, editable source files, and integration with professional software, Voyager is a natural first choice to evaluate. Its value lies in connecting generation with the work required to revise and finish creative projects, rather than treating the first generated asset as the final deliverable. Teams can explore Voyager pricing, supported workflows, and the available model catalog to determine which capabilities fit their production needs.
Frequently asked questions
What growth do researchers project for the graphic design market in 2027?
Mordor Intelligence estimates the global graphic design market at $59.29 billion in 2026 and projects growth to $85.53 billion by 2031, representing a 7.60% compound annual growth rate. Its publicly available report does not provide a separate estimate for 2027. The forecast covers professional design services, freelancers, creative platforms, and related visual communication activities rather than graphic design software alone. Continued demand for digital content and design services is expected to support market expansion, although actual growth may vary by region and specialization.
How has AI adoption changed graphic design workflows?
A study published in September 2026 found that 79.7% of surveyed designers used AI tools in at least one design workflow phase, while only 35.1% of AI adopters reported using them across all four phases. The findings suggest that AI is increasingly integrated into research, ideation, development, and delivery, but adoption varies by task and workflow requirements. Designers continue to rely on professional judgment when evaluating generated results, making revisions, and preparing final deliverables. These patterns also highlight the importance of AI-assisted design workflows that support both experimentation and refinement.
Are businesses reducing graphic design budgets because of AI?
Clutch's February 2026 survey found that 47% of respondents had increased their graphic design budgets over the preceding 12 months, while 53% expected further increases during the following year. Although 88% reported using AI design tools, only 18% said AI had reduced their need for human designers, while 25% reported increased design output requirements. These findings suggest that AI adoption and continued investment in professional design services can occur simultaneously. However, the survey does not establish that AI directly caused budget increases or predict confirmed spending outcomes for 2027.
What do graphic designers earn in 2026?
The U.S. Bureau of Labor Statistics reports a median annual wage of $62,960 for employed graphic designers as of May 2025, with the highest-paid 10% earning more than $104,910. ZipRecruiter estimated average annual pay of $72,122 for freelance graphic designer positions as of November 15, 2026, using employer job postings and third-party data rather than verified freelance earnings. These figures use different methodologies and should not be directly compared. The BLS separately reports a $104,000 median wage for web and digital interface designers in May 2025, reflecting a distinct occupational category.
Which regions show the strongest graphic design market growth?
Asia-Pacific leads projected regional growth at 11.10% CAGR through 2031, nearly 1.5 times the global forecast rate of 7.60%. North America held the largest share of the defined global graphic design market at 39.10% in 2025, reflecting its established creative industries and business demand for design services. Growth expectations for Asia-Pacific are associated with expanding digital adoption, e-commerce activity, and demand for visual content across emerging markets. Within the same market forecast, freelancer marketplaces are projected to grow at 12.10% CAGR through 2031, although regional and segment forecasts measure different aspects of the industry.
Voyager is a desktop AI agent for creative work
Describe what you want to make; Voyager plans it, uses your apps and tools, and keeps everything editable.