UGC video ad statistics give reasons to test creator content, with different comparisons behind each number. TikTok reports 70% higher click-through rates for creator ads; Meta reports 19% lower acquisition costs when partnership ads join an existing campaign mix. Neither establishes the return on every customer-style video or includes your production bill.
The short version: use platform outcomes to frame a test, shopper research to brief the footage, and creator fees to scope the quote. Measure orders and production costs together before scaling. The 30 figures below include 11 platform-reported performance figures, three creative-effectiveness findings, and evidence on shoppers, buyers, fees and spending.
Key takeaways
- Meta reports 19% lower acquisition costs when partnership ads join an existing campaign mix; the result does not include your production bill.
- Collabstr’s $154 average final UGC engagement cost does not specify a standardized video length or paid-usage package.
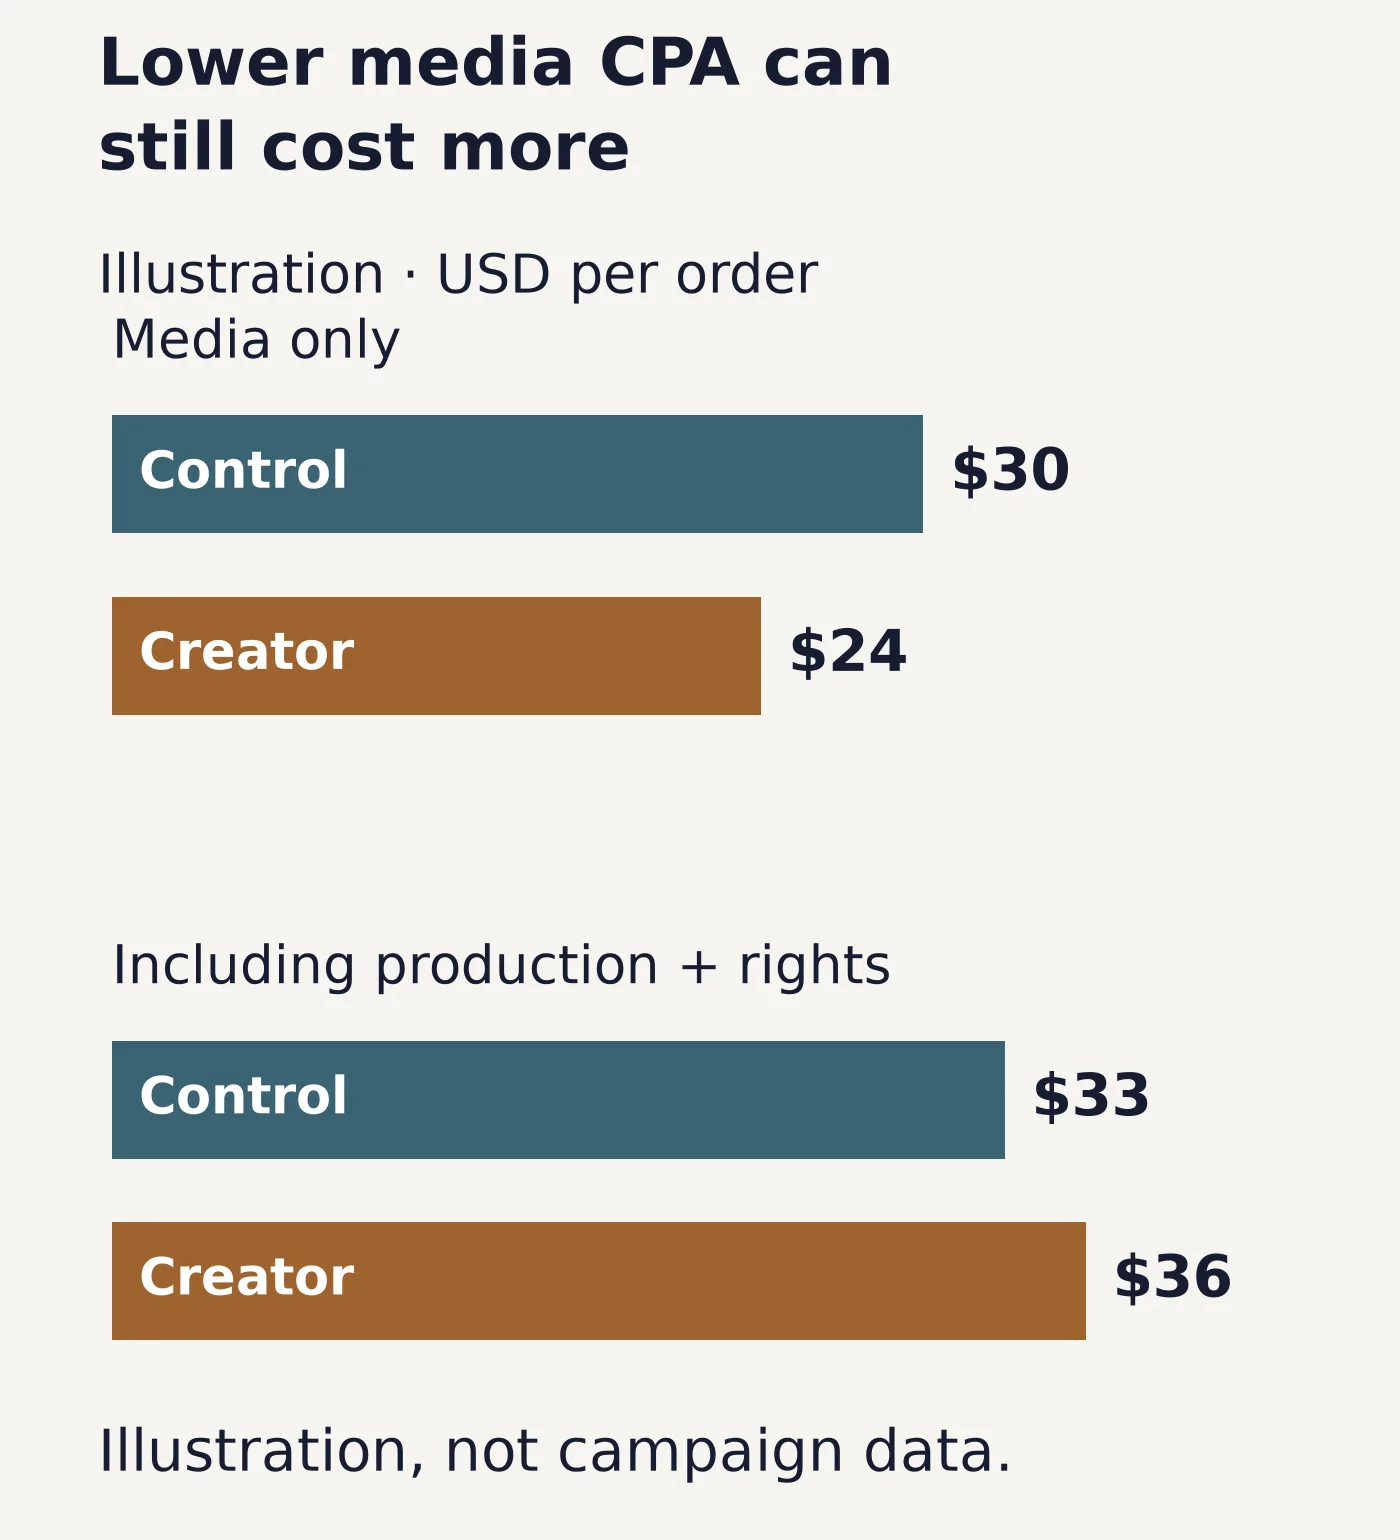
- In our hypothetical budget, creator ads lower media CPA from $30 to $24 while raising cost per order including production from $33 to $36.
We opened the linked primary sources on 29 October 2026. Study dates and denominators appear with each group; several figures come from the same study. Voyager, the desktop app our team builds, helps produce and revise creative assets; these studies do not measure its ad performance. Our budget calculations below use explicitly hypothetical inputs.
At a glance: figures you can cite with their context
| Figure | Context and primary source |
|---|---|
| +70% click-through rate | Creator vs non-creator ads; sample undisclosed. TikTok, Nov 2025; content from Feb 2024 to Jan 2025. |
| −19% acquisition cost | Adding partnership ads to an existing mix; about 2,400 advertisers. Meta, Mar 2026; June 2025 experiment. |
| +43% conversion rate | Spark vs Non-Spark; study coverage undisclosed. TikTok help, Mar 2026. |
| −19% attention decay | Early brand recognition; 8,000 heavy TikTok users. TikTok/System1, May 2025. |
| $154 average final UGC cost | Marketplace engagement; no fixed video/rights bundle. Collabstr, 2026 report; 2025 activity. |
| 46% trusted short-form video | 8,000+ consumers, six countries. Bazaarvoice, Mar 2025; Jan 2025 survey. |
All sources read 29 October 2026. CTR means click-through rate, CVR conversion rate, CPA cost per acquisition and CPM cost per thousand impressions. These are separate populations and outcomes, so we do not average their lifts. Customer reviews, commissioned creator footage, creator-account distribution and customer-style ads describe different things. Spark Ads use TikTok posts; the format alone does not tell you who made the video.
TikTok: separate ad format from creator content
TikTok's Video Shopping Ads help page, updated March 2026, reports four Spark versus Non-Spark comparisons. The sample, field dates, assignment method, uncertainty, placements and objectives are undisclosed. The update date is not a study date, and the documentation context does not establish shopping-only or all-campaign coverage.
1. Spark conversion rate was reported 43% higher
The help page reports +43% conversion rate. This is a relative change, not 43 percentage points. Define which conversion and denominator your own report uses.
2. Spark engagement rate was reported 142% higher
The same comparison reports +142% engagement rate. Interactions and orders need separate reporting.
3. Spark video completion rate was reported 30% higher
TikTok reports +30% completion rate. Completion depends on what viewers are asked to finish; compare video lengths alongside it.
4. Spark CPM was reported 4% lower
TikTok reports −4% CPM, the media cost per thousand impressions. This excludes the cost of commissioning footage.
Choose this evidence if planning a Spark-format pilot. Before buying: confirm post authorization and keep format and creative authorship separate in the test.
TikTok's 24 November 2025 Creator Advantage analysis addresses a different comparison: creator versus non-creator ads. Its footnote dates the creator content to February 2024–January 2025; sample size and assignment are not given.
5. Creator ads had a reported 70% higher click-through rate
TikTok reports +70% click-through rate at the same CPM. This is campaign analysis, without a disclosed randomized design.
6. Creator ads had a reported 159% higher engagement rate
The same analysis reports +159% engagement. This and the Spark figures answer different questions; they are not independent confirmations of one universal lift.
Choose this evidence if deciding whether to commission creator footage. Before a brief: specify whether the footage runs from the brand account or the creator's account.
Meta: adding partnership ads and expanding placements
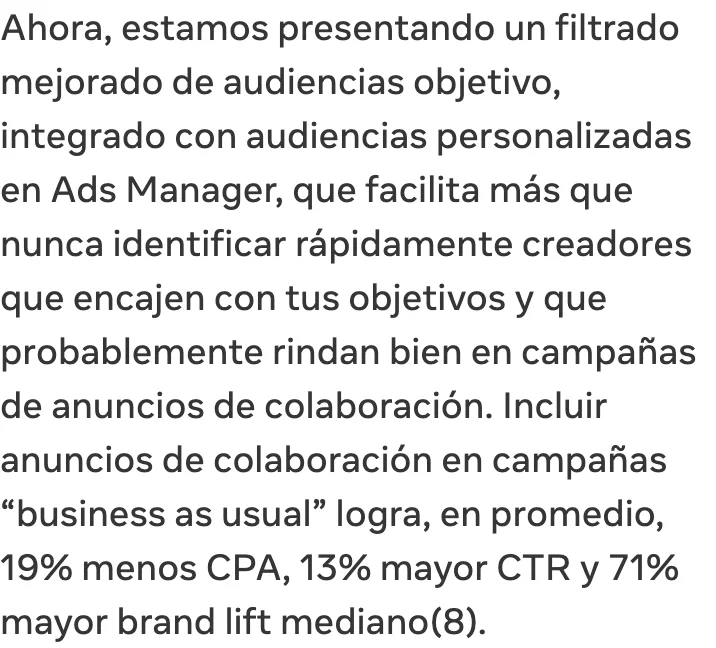
Meta's March 2026 announcement, footnote 8, describes a 14–21 June 2025 experiment: about 2,400 advertisers, across placements, link-click/offsite-conversion types. Treatment combined existing assets with partnership ads; a video-only subgroup is unspecified.
7. Adding partnership ads delivered 19% lower CPA
Meta reports −19% acquisition cost.
8. The mixed approach delivered 13% higher CTR
Meta reports +13% click-through rate.
9. Median brand lift was 71% higher
Meta reports +71% median brand lift.
Open the Meta source excerpt at full size.
Footnote 9's separate A/B experiment compared upper-funnel partnership ads on Facebook plus Instagram versus Instagram alone, 5–8 March 2026. It reports 30% user allocation and 90% confidence; advertiser count is absent.
10. Facebook plus Instagram delivered 18% more conversions
Meta reports +18% conversions.
11. Cost per conversion was 5% lower
The placement experiment reports −5%.
Choose this evidence if testing a creator mix or placements. Before scaling: keep those hypotheses separate.
Creative decisions: early recognition, hooks and fatigue
TikTok and System1's 5 May 2025 research summary describes induced exposure frequencies within one session, with 8,000 heavy TikTok users in the US, UK, Germany, France, Italy and Spain. Ads covered ecommerce/fashion, food/snacks and health/beauty. These are creative-response findings, not a sales experiment or a measured number of days until fatigue.
12. Early brand recognition generated 57% more happiness
Ads with recognition in the first two seconds generated +57% happiness. Try making the product recognizable within the action rather than adding a separate logo intro.
13. Early recognition achieved 19% less attention decay
TikTok/System1 reports −19% attention decay. This motivates recognizable openings; it cannot prescribe a refresh calendar.
14. Early branding increased brand choice by 25%
The summary reports +25% brand choice for well-branded early content. Brand choice in this study is distinct from observed checkout purchases.
TikTok's June 2025 creative guidance recommends a hook within six seconds, a proposition within three, captions for context and visibly different creative options. We would turn that into this illustrative brief for an insulated lunch bag, not a claim that one format wins:
| Version | Proposed footage and decision |
|---|---|
| Demonstration | Show the actual containers fitting inside; identify the bag immediately. If attention holds but orders lag, inspect the offer and landing page. |
| Presenter | State a packing problem, then show the same fit test. If orders improve, try another presenter using that proof. |
| Shorter edit | Cut explanation while retaining the demonstration and offer. Compare orders and cost alongside completion at each length. |
Keep the product, offer and approved claims constant. For a style test, hold duration constant first; test length afterward. Record hook, presenter, demonstration, duration, caption treatment and offer for each asset so the next brief follows the result.
Choose this evidence if planning openings or revisions. Before repeat production: inspect attention and acquisition trends together. TikTok advises refreshing when performance consistently declines; an ad remaining active does not reveal its profitability.
Shopper credibility: what the video should substantiate
Bazaarvoice's 12 March 2025 release reports January 2025 Savanta research among 8,000+ consumers in the US, UK, Germany, France, Australia and Canada. These six figures describe stated attitudes and discovery, rather than paid-ad outcomes.
15. Short-form video earned trust from 46%
The shopper survey records 46% for short-form video trust.
16. Real customer reviews led final-purchase factors at 52%
52% named real customer reviews as the biggest factor in their final purchase decision.
17. Real-life photos or videos were a trust cue for 35%
Bazaarvoice reports 35% for this content attribute. We would show the actual product where fit or operation matters.
18. Overly promotional creator content drew distrust from 52%
The survey records 52% for this concern.
19. Acknowledging pros and cons signaled authenticity to 43%
Bazaarvoice reports 43% for creators acknowledging both sides of a product.
20. Social media introduced products to 32%
32% reported social discovery, encompassing more than paid creator ads.
Choose this evidence if selecting what a creator should show. Before commissioning: distinguish a real customer's experience from a paid scripted performance and agree what the footage must substantiate.
Creator buyers: match the metric to the job
IAB/Advertiser Perceptions' November 2025 report, page 41, surveyed 453 US brand/agency decision-makers, 28 July–12 August 2025. Eligibility required planned annual advertising of $1 million+ and creator marketing of $100,000+. This is an established-buyer sample.
21. Awareness was a main goal for 43%
Page 22 records 43%, with up to three objectives selectable.
22. Online sales or conversions were a main goal for 32%
The same question records 32%. It measures priorities, not achieved conversions.
23. Overall ROI was a top-three KPI for 40%
Page 23 records 40%, not the share achieving positive returns.
24. Creator reputation was very important to 58%
The direct-partner selection question records 58%.
25. Audience alignment was very important to 56%
The same question records 56%. For creator-account distribution, inspect audience fit alongside the footage.
Choose this evidence if defining success or screening creators. Before contracting: agree whether the job includes posting, paid usage, revisions and alternate hooks.
Creator fees: price a usable deliverable
Collabstr's 2026 report analyzes first-party marketplace data, including 472,000+ packages and 21,000 collaborations, describing 2025 activity. Its UGC category is platform-agnostic; the pricing section gives no UGC-only sample or standardized video length, asset count and rights bundle.
26. UGC creators asked an average of $180 per engagement
Collabstr lists $180 as the average posted UGC rate. Asking prices are not paid invoices.
27. Average final UGC cost was $154 per engagement
The platform's final-cost series lists $154. It is not a quote for one finished video with perpetual paid rights.
28. 80% of marketplace engagements cost under $300
Collabstr reports 80% across all engagements, including categories beyond UGC. The UGC-specific fee distribution is not supplied.
The separate $197 campaign average is unreconciled with the $154 engagement series; keep those units distinct.
Choose this evidence if checking the scale of marketplace quotes. Before purchase: request itemized footage, edits, revision rounds, posting, paid-usage term/platforms, creator-account authorization and renewal charges. Compare cost per accepted ad after those conditions match.
US creator-ad spending: a dated planning estimate
IAB's November 2025 model includes intentional partnerships, amplification and planned advertising adjacencies, beyond UGC video. It combines financial information, buyer survey results and Advertiser Perceptions research.
29. US creator advertising was estimated at $29.5 billion in 2024
Page 7 gives the historical estimate.
30. IAB forecast $43.9 billion for 2026
Page 7's November 2025 forecast is a projection, not a confirmed 2026 total.
Choose this evidence if sizing the opportunity. Before allocation: use your unit economics to set spending.
Worked budget: a lower media CPA can still cost more
Consider an illustrative comparison, calculated for this article. No campaign was run. Both arms spend $3,000 in media. Assume the control produces 100 attributed orders with $300 production, while the creator treatment produces 125 orders with $1,500 production and usage costs. All amounts are assumed USD, not creator quotes or expected results.
| Measure | Control | Creator treatment |
|---|---|---|
| Media spend | $3,000 | $3,000 |
| Production and rights | $300 | $1,500 |
| Attributed orders | 100 | 125 |
| Media CPA | $30 | $24 |
| Cost per order including production | $33 | $36 |
Media CPA improves 20%, yet cost including production rises about 9.1%. Assuming $25 contribution per order before advertising after product, fulfillment, payment and expected return costs, the example loses $800 on the control and $1,375 on the treatment. More orders alone do not justify scaling.
Open the cost comparison chart at full size.
We calculated a 16-scenario sensitivity table varying media spend and production cost. At $3,000 media and $1,500 production, media CPA must reach $22 to match the control's $33 total cost per order, or $16.67 to break even on the assumed $25 contribution. The latter is stricter because the control itself loses money. These thresholds assume all attributed orders are incremental; use lift measurement to establish that before interpreting them as profit thresholds in a real campaign.
Download the illustrative sensitivity CSV and calculation method with reusable Python. Replace the inputs with your own costs and contribution. Allocate production over a defined usage period; do not charge one arm for a whole shoot and the other for only a single edit.
For a six-ad package costing $1,500, cost per accepted ad is $250 if all six pass review, and $500 if only three do. An accepted asset should meet the approved claims, technical specification, revision requirements and agreed paid-usage terms. Record rejected assets and remake costs so a low headline fee cannot hide unusable footage.
A reusable test worksheet
- Choose one question. To test adding creator ads, compare a fixed baseline campaign mix with that mix plus creator assets at the same total media budget. To test presenter versus demo, keep account identity, placements and format constant. Use the platform's randomized split-test facility where available; label an ordinary comparison observational.
- Write the agreement and cost sheet. Record creative permissions, posting/authorization, platforms, usage period, edit rights and renewals. Add creator fees, product/shipping, editing, internal review time, remakes and media to the budget. Set an accepted-ad definition before delivery.
- Fix measurement before launch. Use the same audience eligibility, offer, landing page, optimization event and attribution window. For example, choose seven-day click attribution for both arms and report view-through separately. This is a proposed convention, not a claim about a platform default. Deduplicate orders against your transaction records.
- Name the primary outcome and stopping rule. For this sales example, use total cost per new-customer order and contribution after advertising. Set the minimum worthwhile change, sample/spend plan, duration and loss cap from your baseline; allow the attribution window to mature. Avoid selecting a winner from an early handful of orders.
- Change the next brief from the result. Higher watch time without cheaper orders calls for inspecting the offer, proof and landing page. Cheaper media orders with costly remakes calls for better acceptance criteria or a revised quote. Replicate a promising result before expanding spend substantially; use a holdout or conversion-lift study when the question is incremental sales.
For consistent reporting, define the ratios explicitly:
- CTR (click-through rate): link clicks ÷ impressions.
- Post-click CVR (conversion rate): attributed orders ÷ link clicks. Check the platform's actual denominator before comparing its CVR with this definition.
- CPM: media spend ÷ impressions × 1,000.
- Media CPA: media spend ÷ attributed acquisitions; state whether these are orders or new customers.
- Cost per accepted ad: production, rights and remake costs ÷ accepted assets.
- ROAS: attributed revenue ÷ media spend. Contribution return after advertising: (orders × contribution per order − media − production/rights) ÷ (media + production/rights). State your cost definition rather than labeling revenue as profit or leaving “ROI” undefined.
For the revisions this creates, Voyager combines its agent with creative apps and its Video, Design and DAW editors, with an editable handoff. Its FAQ describes the editing routes and prerequisites. Generated footage stays rendered media; the surrounding timeline can be revised. The budget model makes no claim of Voyager-specific ad lift.
Decide by job: what changes the next action?
| Job | Use | Next action |
|---|---|---|
| TikTok format pilot | Spark comparison | Separate format from footage authorship |
| Creator footage brief | Creator analysis and shopper attitudes | Show a product claim the footage can prove |
| Meta campaign mix | Partnership experiment | Test adding creators at a fixed total budget |
| Hook or length revision | Creative-response evidence | Change one variable and track orders too |
| Creator quote | Marketplace fees plus accepted-asset cost | Normalize rights, revisions and deliverables |
| Scale decision | Total acquisition cost and contribution | Replicate, then assess incremental sales |
Frequently asked questions
Do UGC video ads convert better than brand-made ads?
TikTok's Spark help page reports +43% conversion rate with undisclosed study coverage. Its creator-content analysis measures clicks and engagement, while Meta's experiment adds partnership assets to an existing mix. They motivate distinct tests; they do not establish a universal customer-made versus studio-made conversion lift.
Do partnership ads mean replacing brand ads?
The cited Meta experiment combined both asset types. Test a mixed campaign if that is your hypothesis; replacing all brand creative would ask a different question.
How much does a UGC video cost?
Collabstr's $154 final engagement average is marketplace context, without a standardized video or rights package. Request a quote covering the asset count, edits, paid-usage duration, account authorization and renewals, then divide the full production bill by accepted ads.
What length or hook should we commission?
TikTok recommends communicating the proposition in the first three seconds. We would compare a shorter and longer cut of the same proof, measuring orders alongside retention. Completion rates alone do not pick the more profitable duration.
How often should we refresh UGC ads?
TikTok recommends refreshing on sustained performance decline. Track acquisition cost, reach and attention alongside spend and audience changes. A lab exposure study or an ad's visible age cannot supply a universal fatigue deadline.
Does higher ROAS mean the creator ad is profitable?
No. ROAS divides revenue by media spend; production, rights and variable order costs still need accounting. The worked example shows why a lower media CPA can coexist with a higher total cost per order.
What is the 2026 creator-ad market size?
IAB's November 2025 forecast was $43.9 billion for the US. It includes intentional creator advertising beyond UGC video and remains a dated projection.
Voyager is a desktop AI agent for creative work
Describe what you want to make; Voyager plans it, uses your apps and tools, and keeps everything editable.